1. Background
1.1 What Is Grafana
Grafana is a complete observability stack that allows you to monitor and analyze metrics, logs and traces. It allows you to query, visualize, alert on and understand your data no matter where it is stored.
If you are confused about metrics, logs and traces, I recommend Adrian Cole’s talk, titled Observability 3 Ways.
1.2 How We Build Up Service
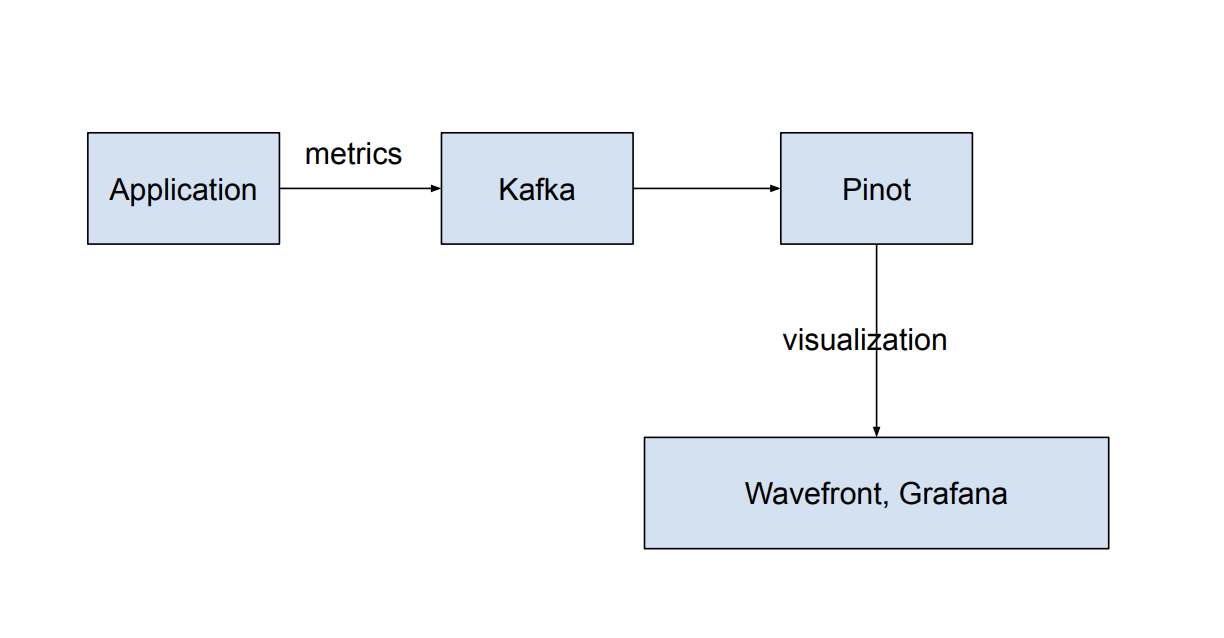
Since this article is mainly focus on giving readers a breif hands on tutorial so I will not spend too much time on this part. Based on my knowledge, our service architecture is like:
2. A Demo
2.1 Know the Panel
- First of all, we need to know the Grafana console first. Go to index page, you will see the navigarion bar:
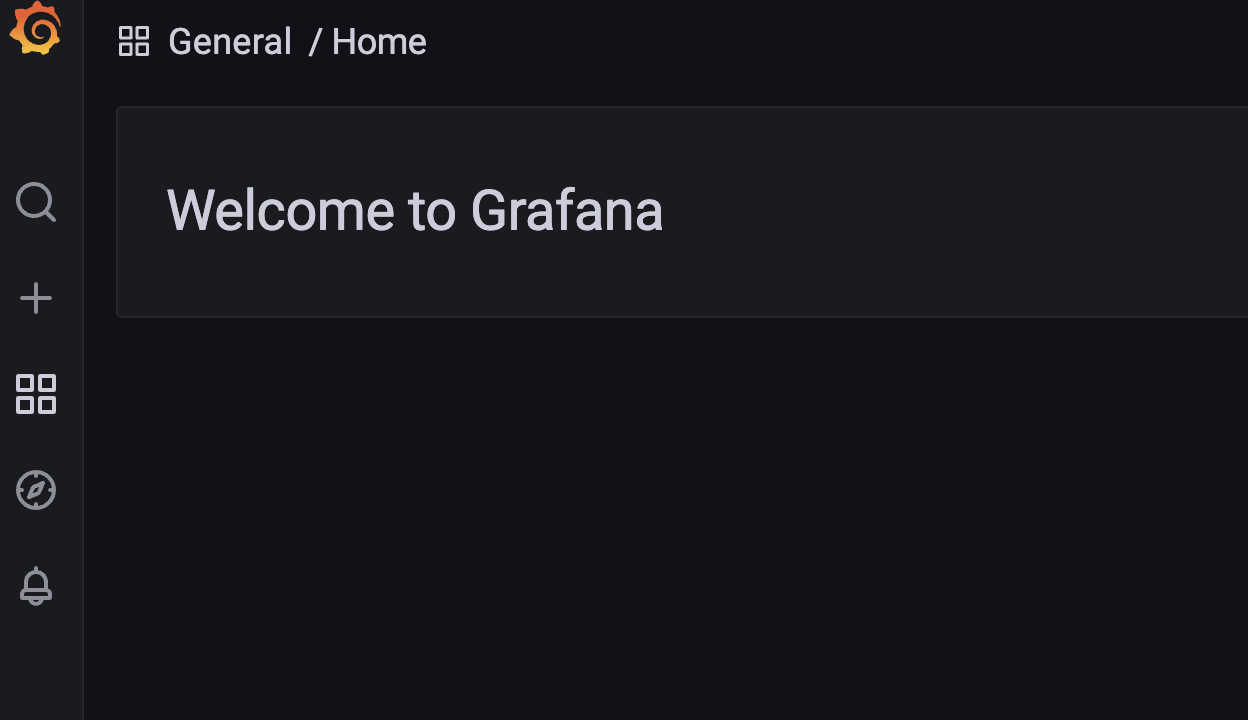
Here we will use the the second cross label to create new dashboard or alerts; the fourth icon like a compass whick is explore(a quick query), and the last ring bell to manage alerts.
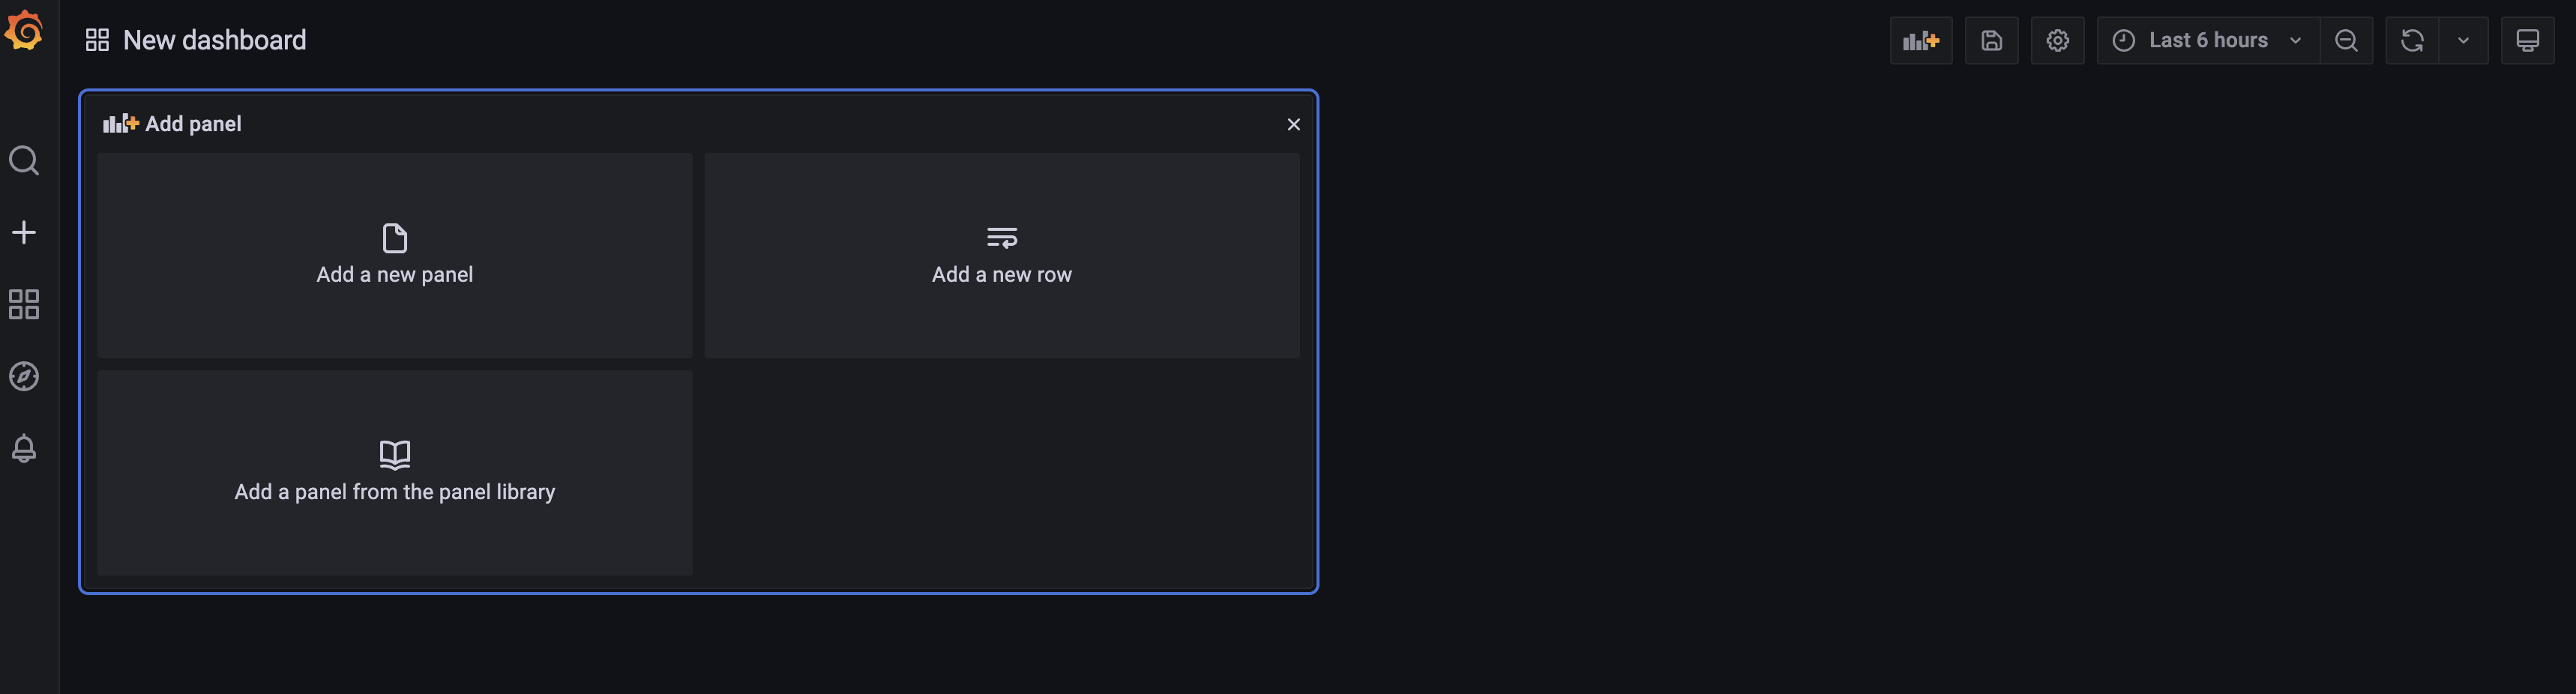
- Once you cick the add "create dashboard", you will be navigate to a new page, and you can just click the "Add a new panel" to add a new dashboard.
- A folder contails multiple dashboards with same department or topic no matter how you orgnize them. A dashboard is compose by many panels, which organized by rows(or sections) inside of a dashboard.
2.2 Build the Dashboard
2.2.1 Before you begin
- Ensure that you have the proper permissions.
- Identify the dashboard to which you want to add the panel.
- Understand the query language of the target data source.
- Ensure that data source for which you are writing a query has been added.
2.2.2 Add a panel to a dashboard(Basic)
-
Navigate to the dashboard to which you want to add a panel. Click the Add panel icon.

-
Click Add an empty panel. Grafana creates an empty time-series panel and selects the default data source.
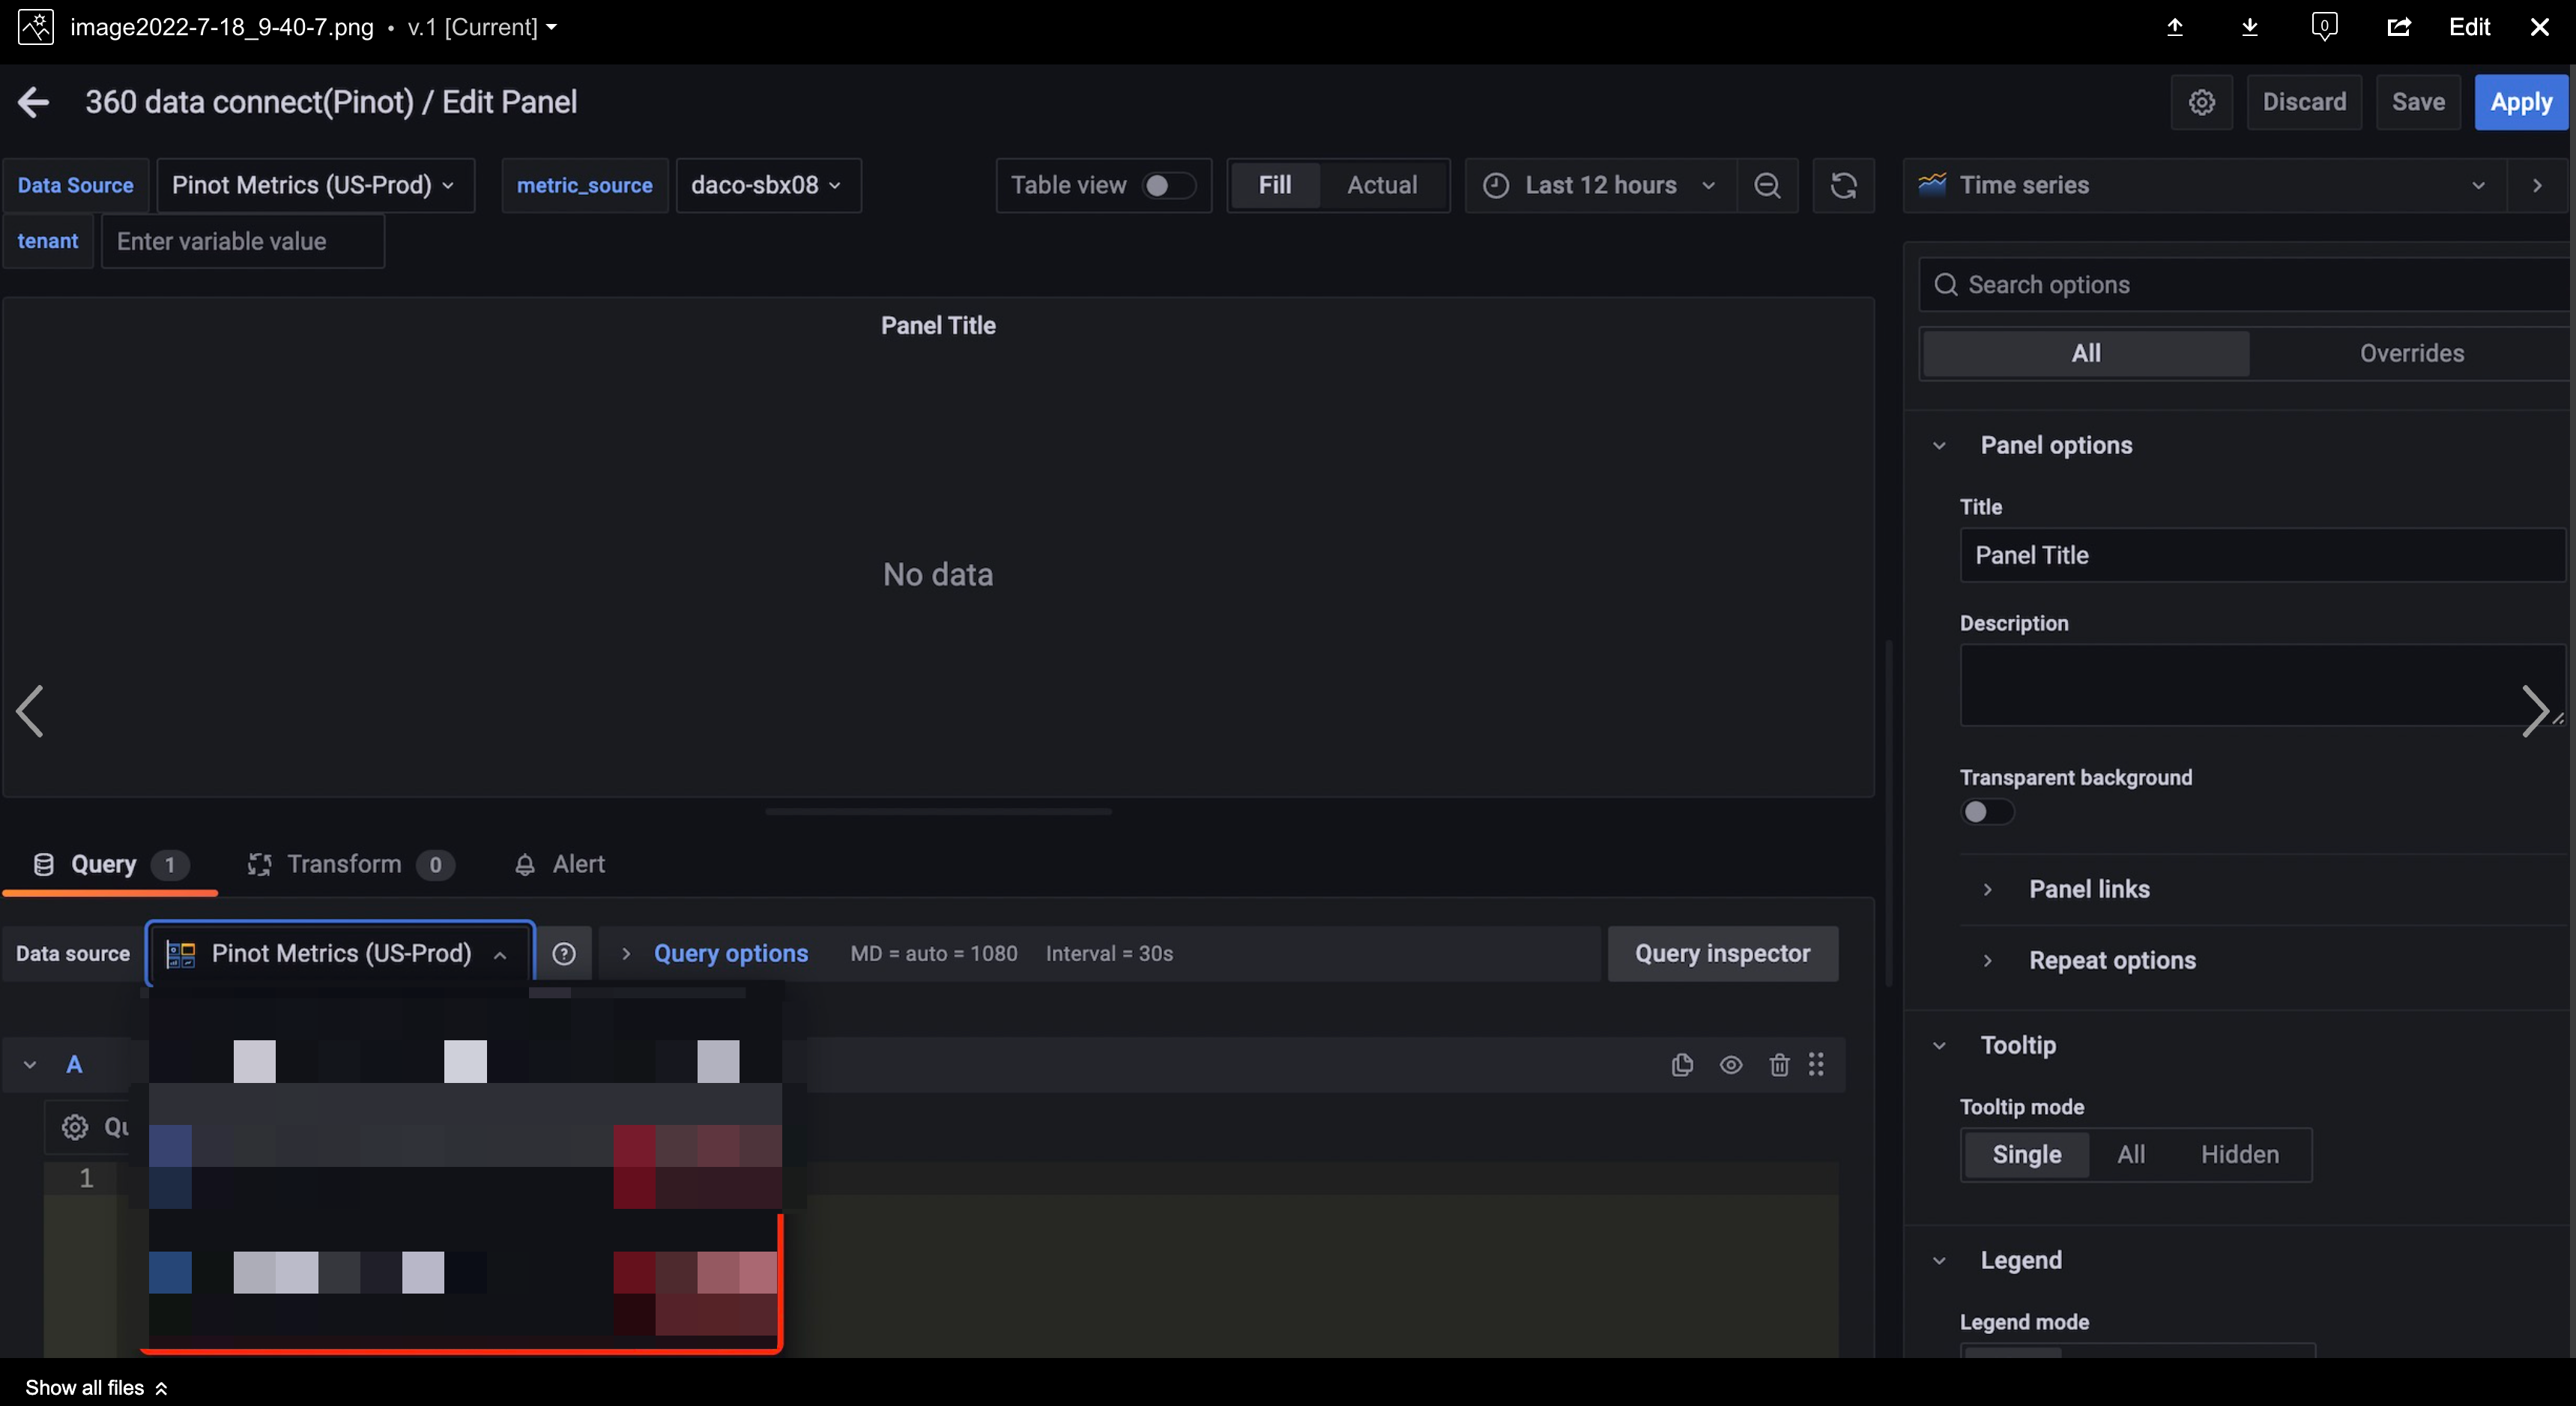
-
In the first line of the Query tab, click the drop-down list and select a data source.
-
Write or construct a query in the query language of your data source.
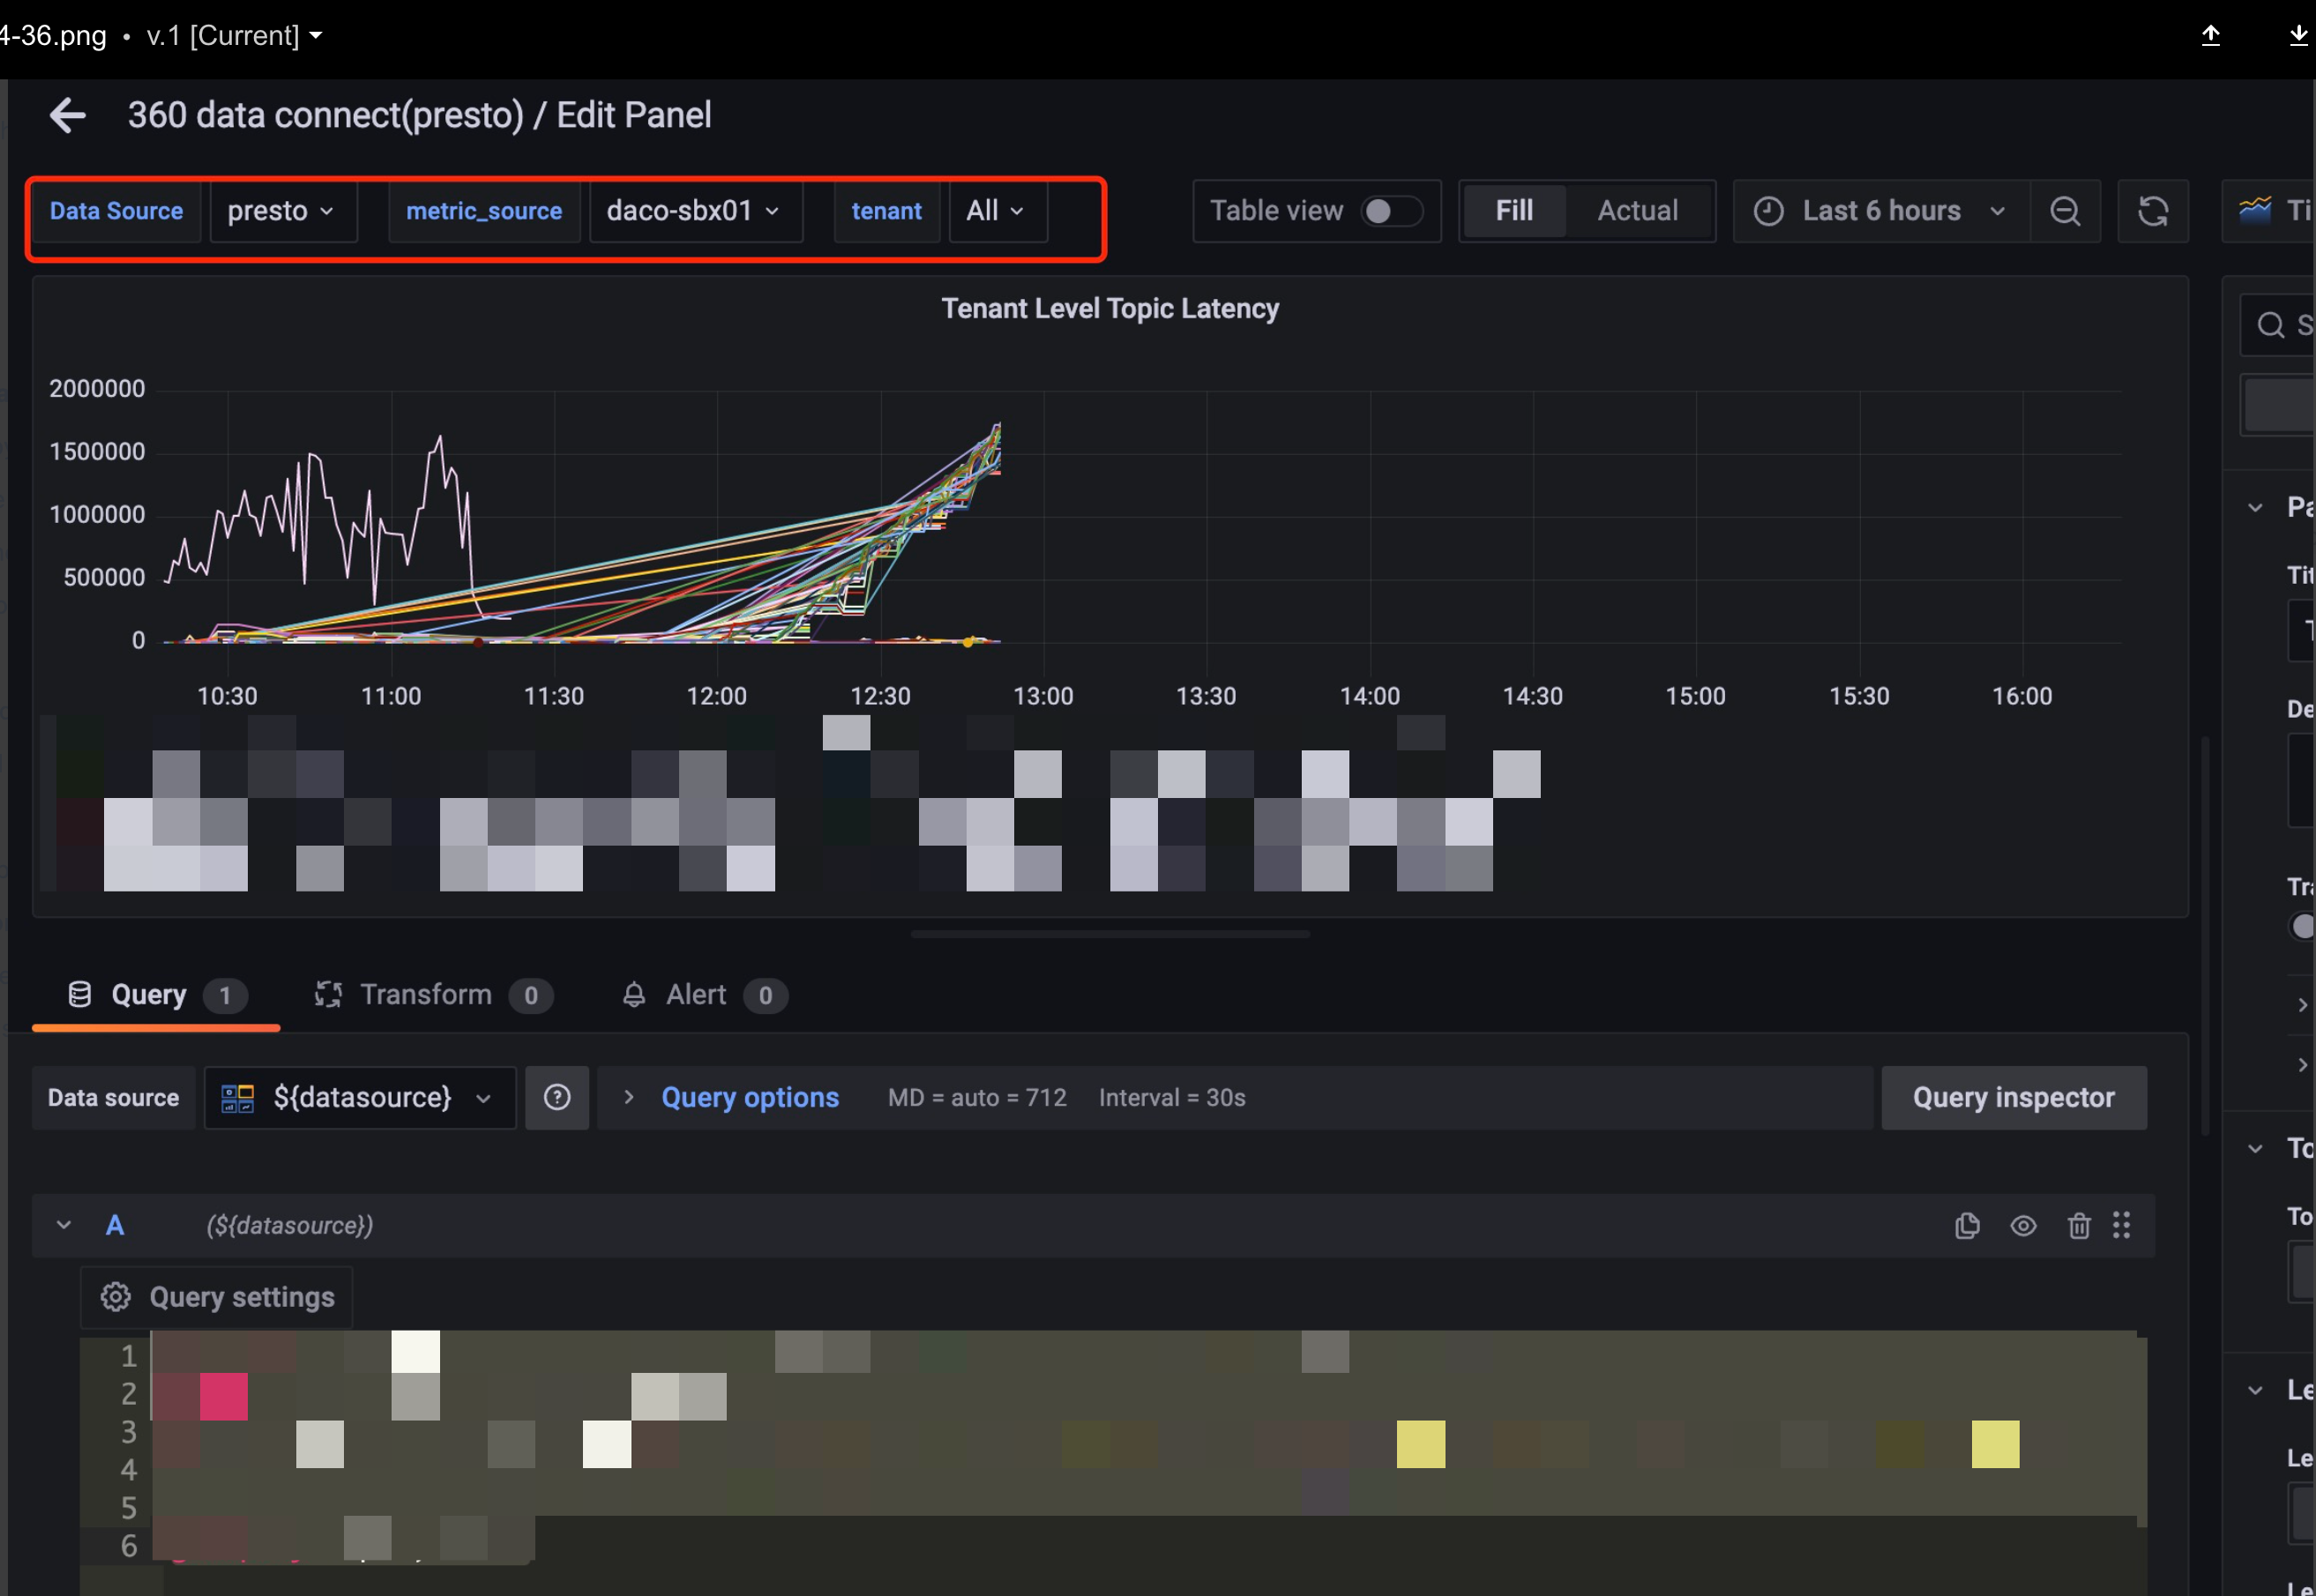
Here is an example, if I want to get the time series of avg(p50) of event 'data-connect.SalesforceConnector.batchSize' group by tenant, filtered by metric_source and tenant from a table in minute time granularity, the query should be like this:
sql select (epoch_minute * 60000) as "Time", tenant, AVG(p50) as p50 from ${table_name} where $__minuteFilter(epoch_minute) and event_type='histograms' and event=${event_name} and metric_source='${metric_source}' group by epoch_minute, tenant order by epoch_minute -
Run the "query inspection" and "refresh". If it runs well, SAVE the chart and dashboard.
-
Add variables in your query if necessary. For example:
You should go to the "settings page of your dashboard" to add your variable, for example,
metric_source='${metric_source}'in the previous query should be configured as below.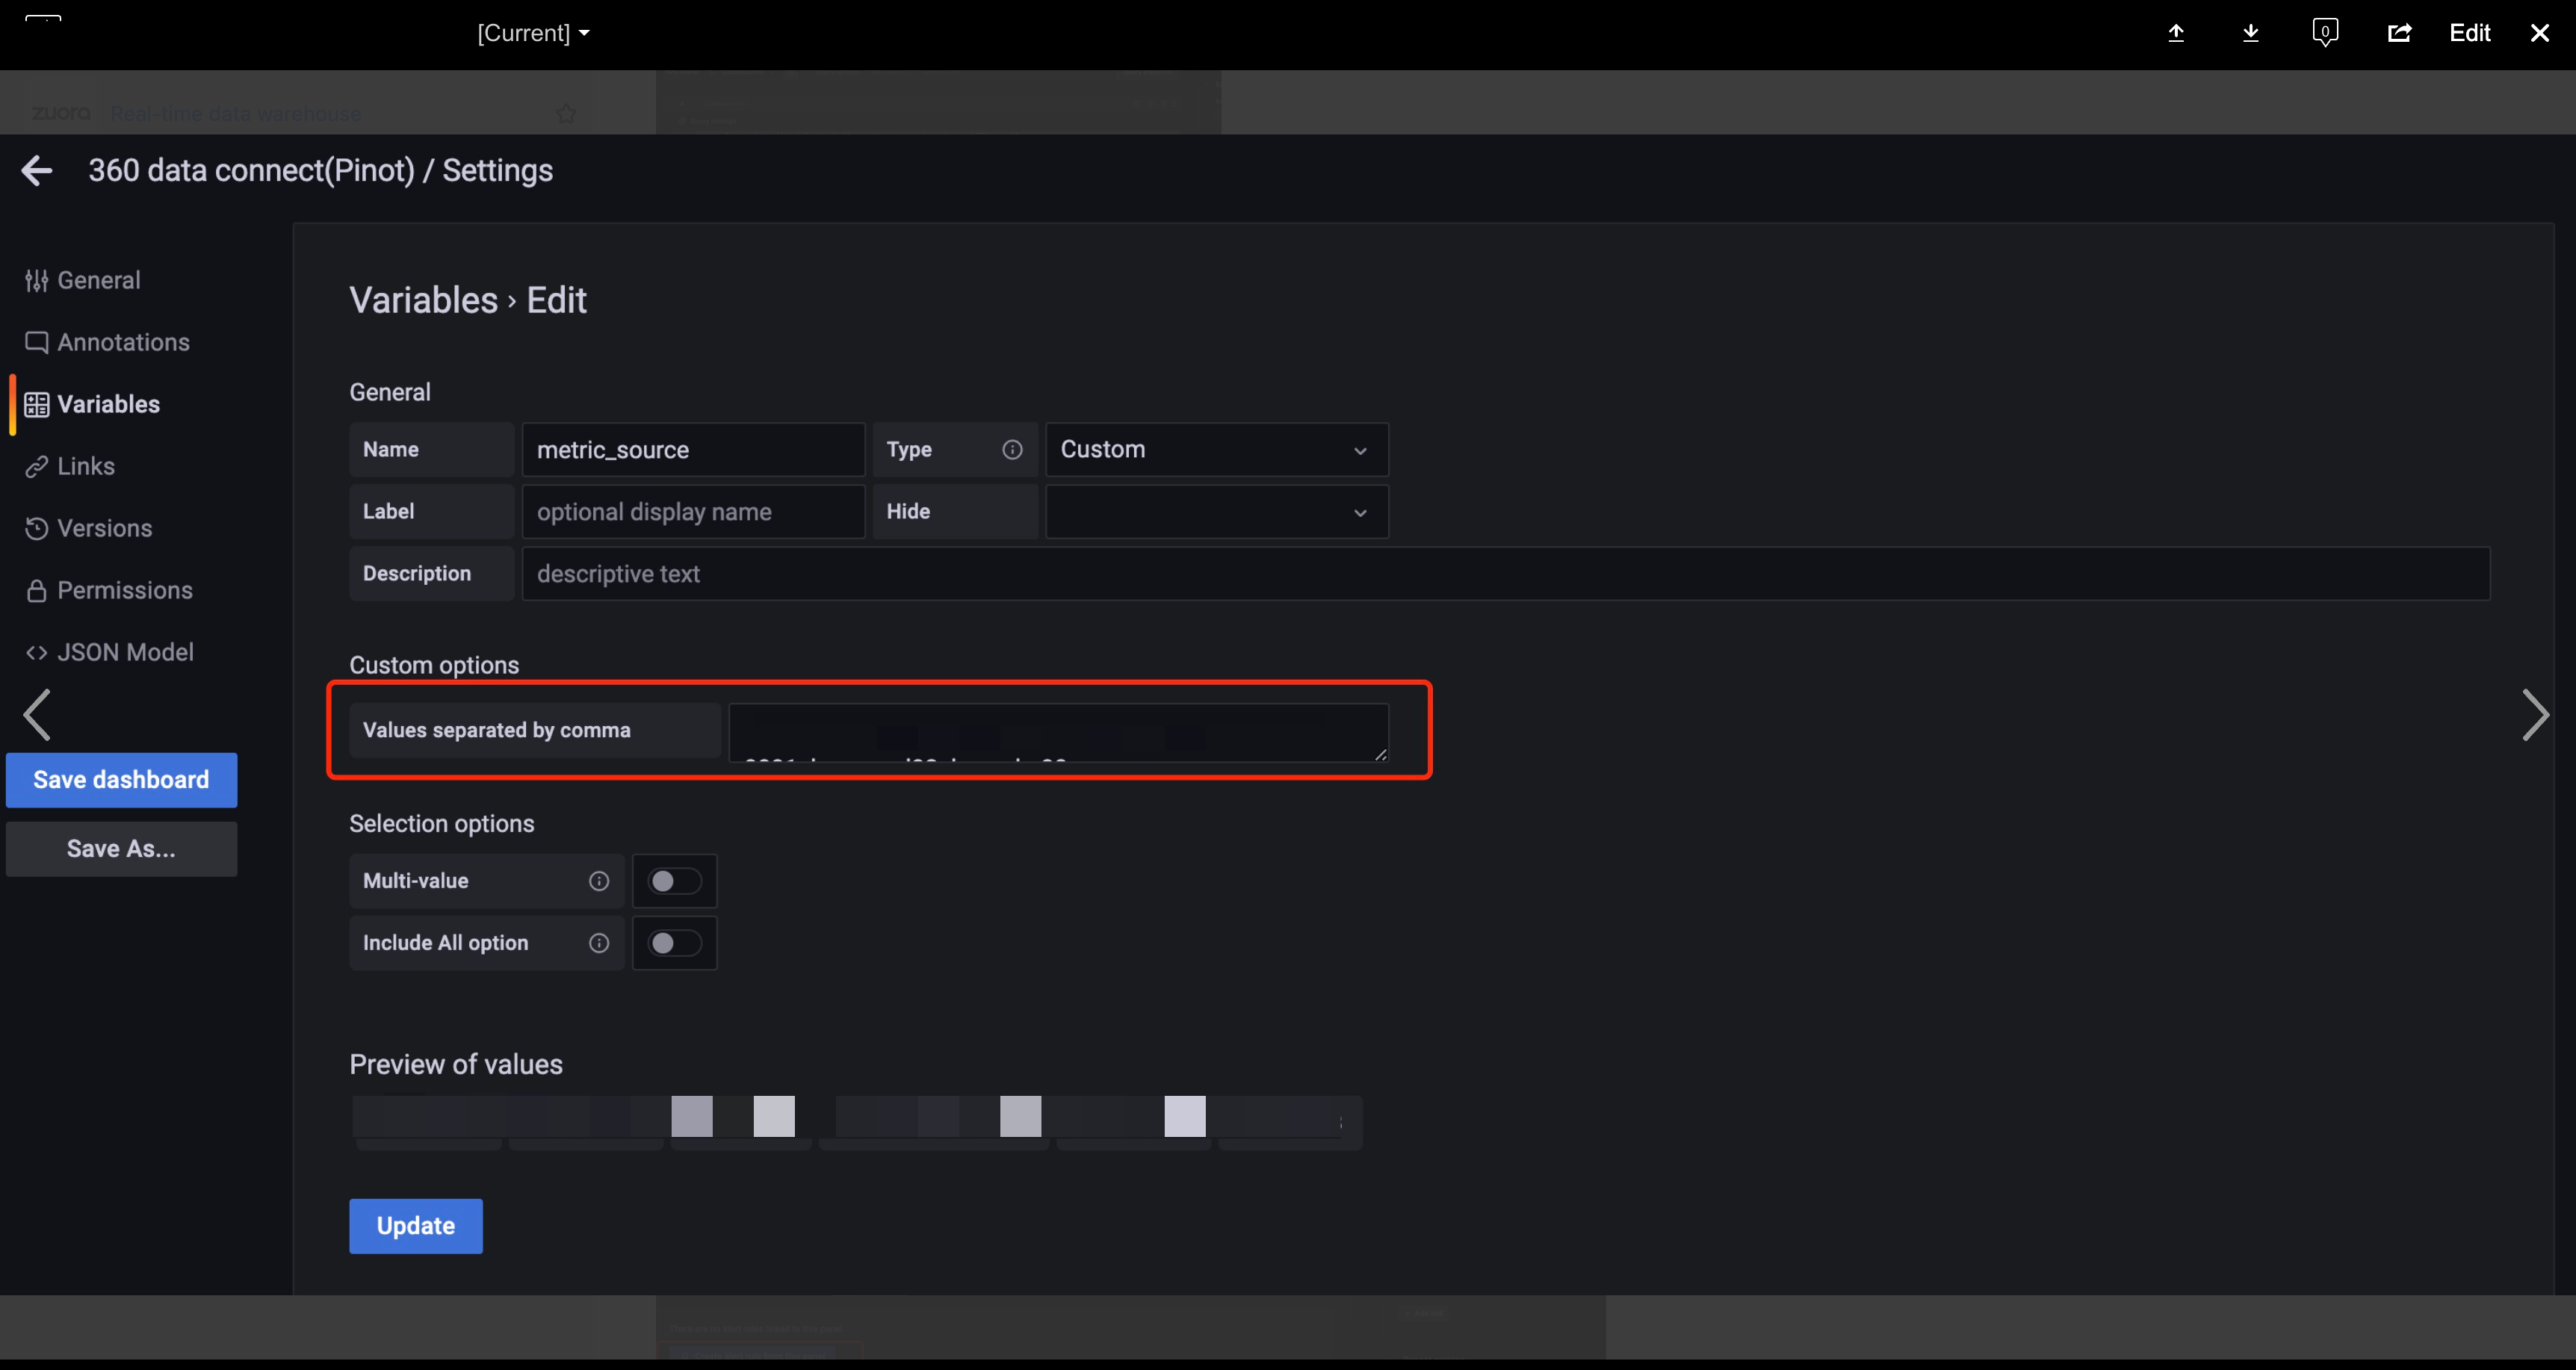
-
In the Visualization list, select a visualization type. It displays a preview of your query results with the visualization applied.
After we set up the type, we could also modify the style of the graph, e.g. title, legend, axis, units and so on.
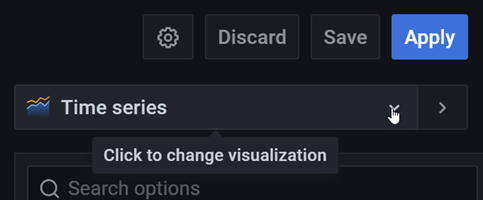
-
DO NOT forget to click “SAVE” and “APPLY” on the right top.

2.3 More Examples
2.2.3.1 Expression
If you need to do some math on the query result, then you could create a Expression and use the query title as the name of variable:
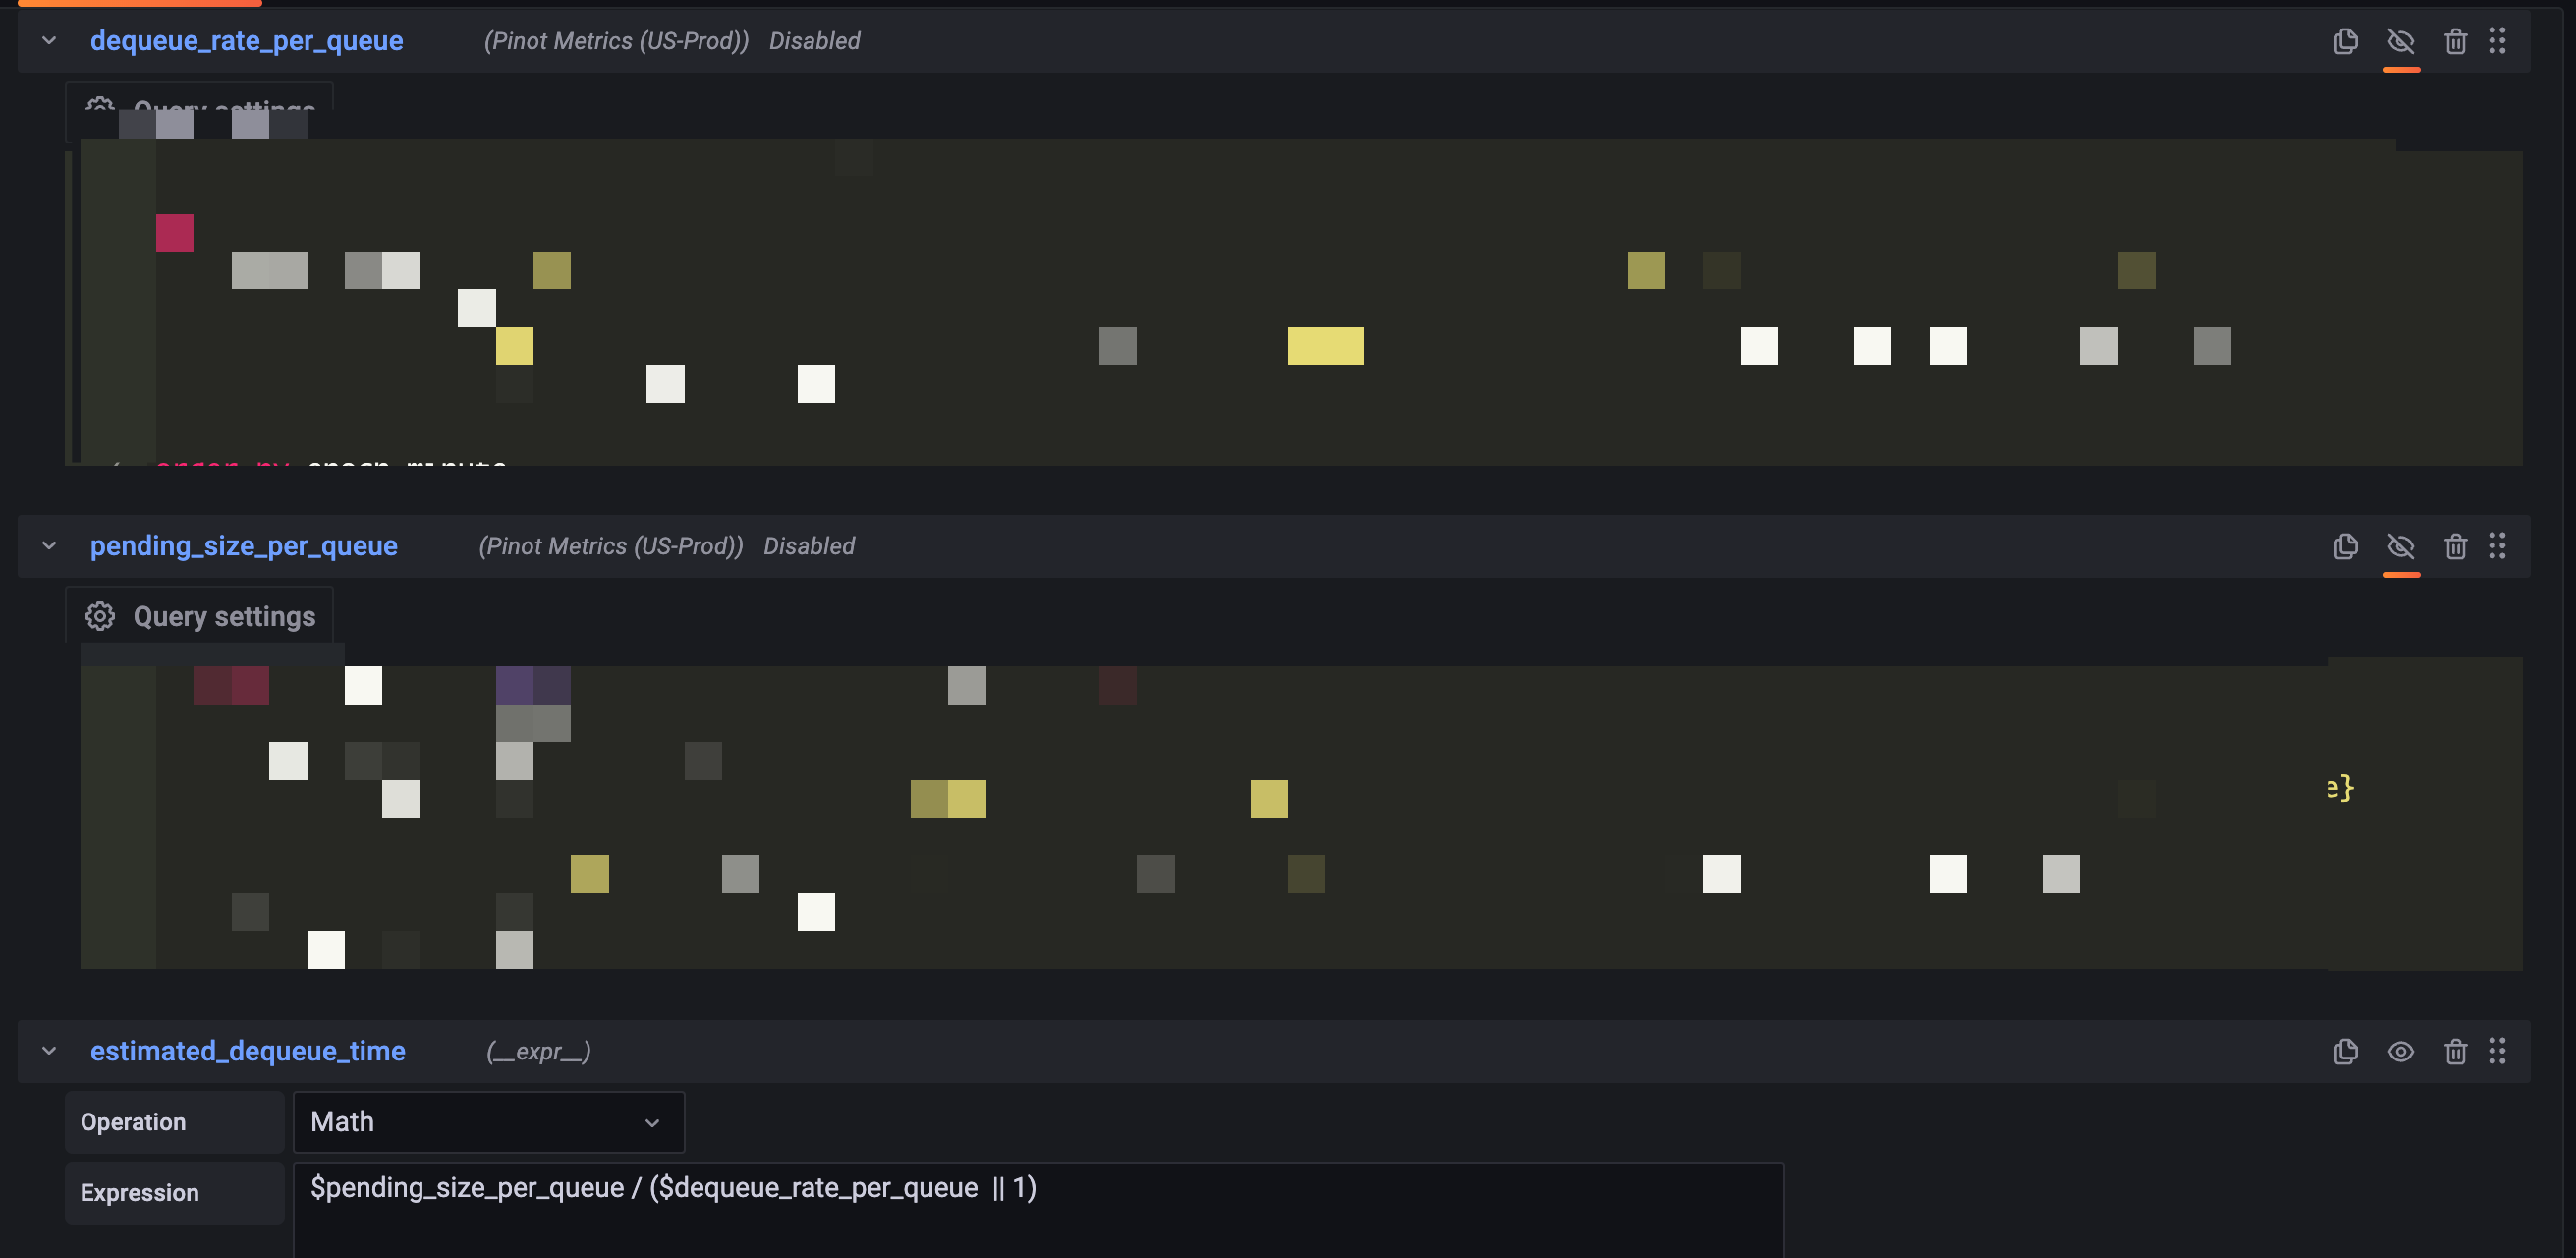
Here we have dequeue rate per queue and pending size per queue, then we could do the math and get the estimated dequeue time.
2.2.3.2 UDF
-
When we query some data from pinot, we may want to do some data transformations before it is shown on the Grafana page. Grafana user define function(UDF) is a custom function to transfer data to another format. You could think UDF as a pipeline. Data go through the UDF(pipeline) will be changed based on the function of UDF.
-
We can applied multiple UDFs to the query. The UDFs are chained together as pipeline. The data go through the UDFs to do transformation in order. For example, the following SQL will get data from pinot first, then the time series data will pass to
ratediff()to do transformation. After thatratediff()result (also time series data) will pass toalign(5m)to do transformation. Finally the result ofalign(5m)will return to Grafana.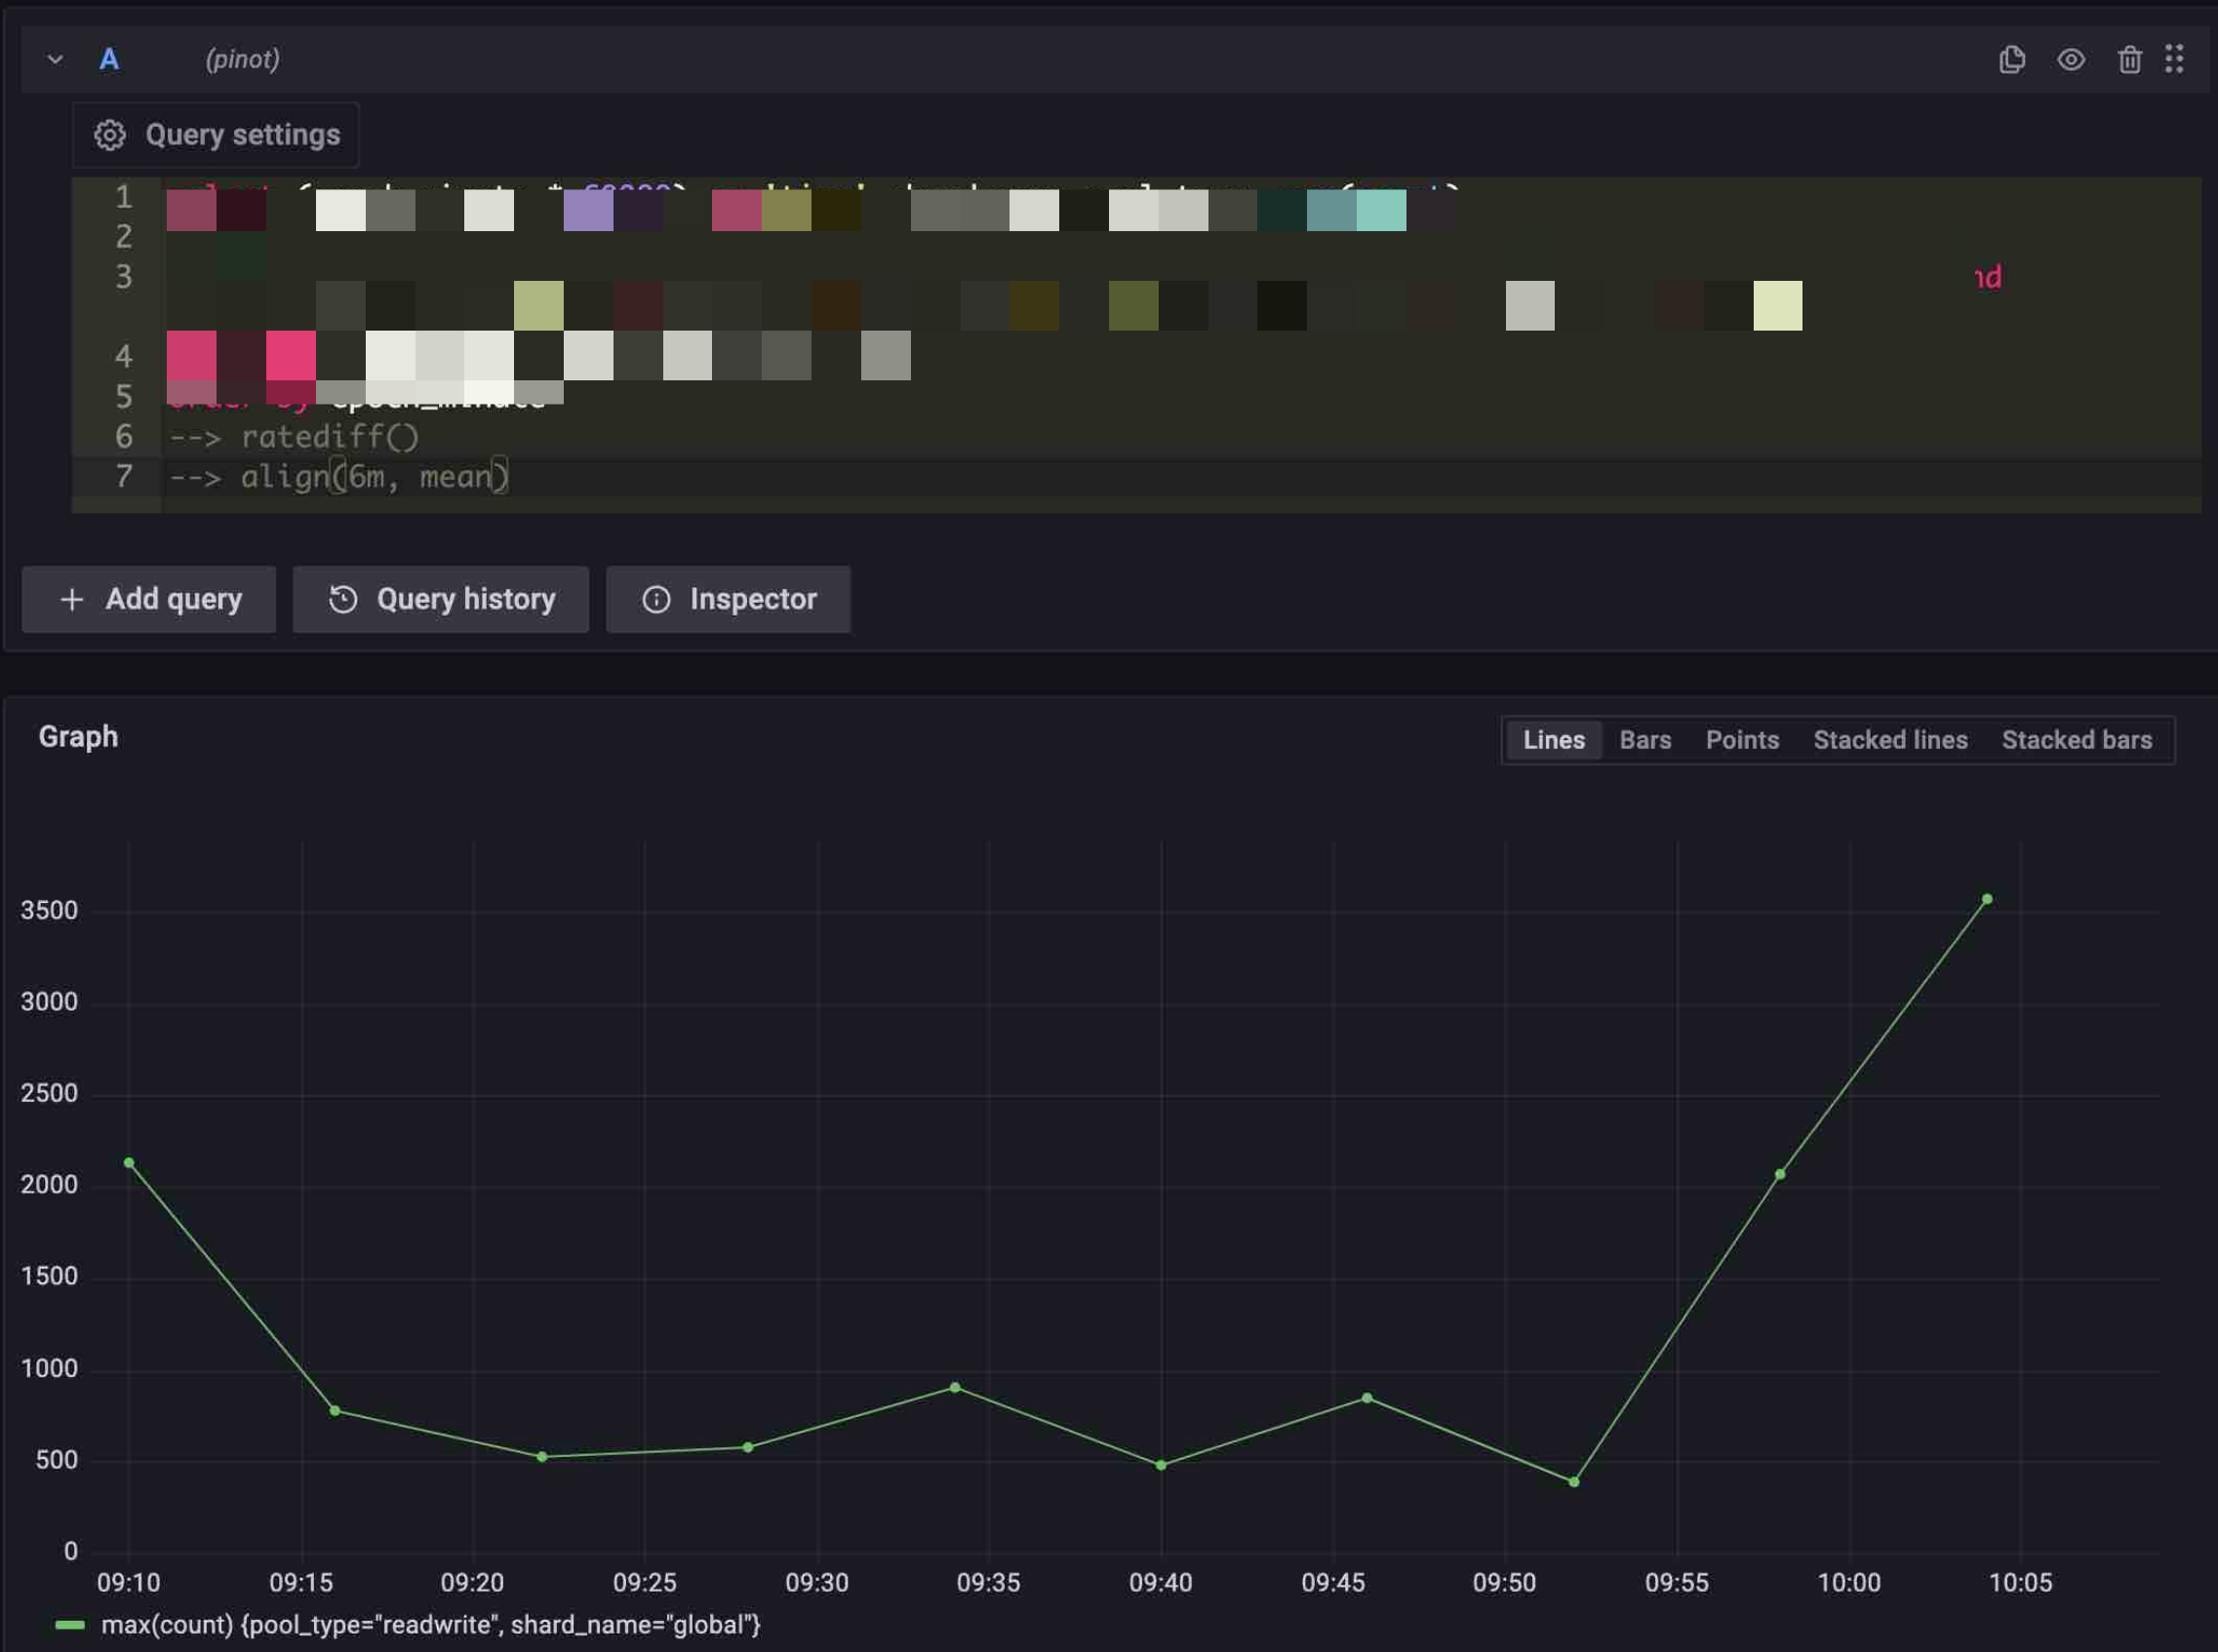
2.4 Best Pricetices
-
Pinot uses SQL as its query language and adopts the MYSQL_ANSI dialect. Pinot does NOT support joins or nested subqueries.
-
"Explore" tab of grafana helps us to query something quickly. For example, if we want to know the service name of a particular metric called 'data-connect.BaseMessageConsumer.topicLatency', we could construct the query like this:
sql
select service_name from ${table_name}
where event=${event_name}
and day=6 and month=9
limit 1
More filters helps reduce the query time.
-
It is known that the panel may not work if it comes from duplicating and modifying another one.
-
Double quotes(") are used to force string identifiers, e.g. column names. Single quotes(') are used to enclose string literals. If the string literal also contains a single quote, escape this with a single quote e.g
'''Pinot'''to match the string literal'Pinot' -
regular expression vs text match
The platform team suggest not use
LIKEin sql and use TEXT_MATCH() for better performance, however, "query data error" happens when the there is no index on the column.If you still want to use some regular expression, you may tru
REGEXP_LIKE()which is a build in function of pinot query. -
If you are using expression and the divisor might be zero, just do a
|| 1to avoid errors.