Estimation
Power of 2
-
A byte is a sequence of 8 bits.
-
An ASCII character uses only 1 byte(8 bits) memory.
-
Data volume
Power Approximate value Full name Short name 10 1 Thousand 1 Kilobyte 1 KB 20 1 Million 1 Megabyte 1 MB 30 1 Billion 1 Gigabyte 1 GB 40 1 Trillion 1 Terabyte 1 TB 50 1 Quadrillion 1 Petabyte 1 PB
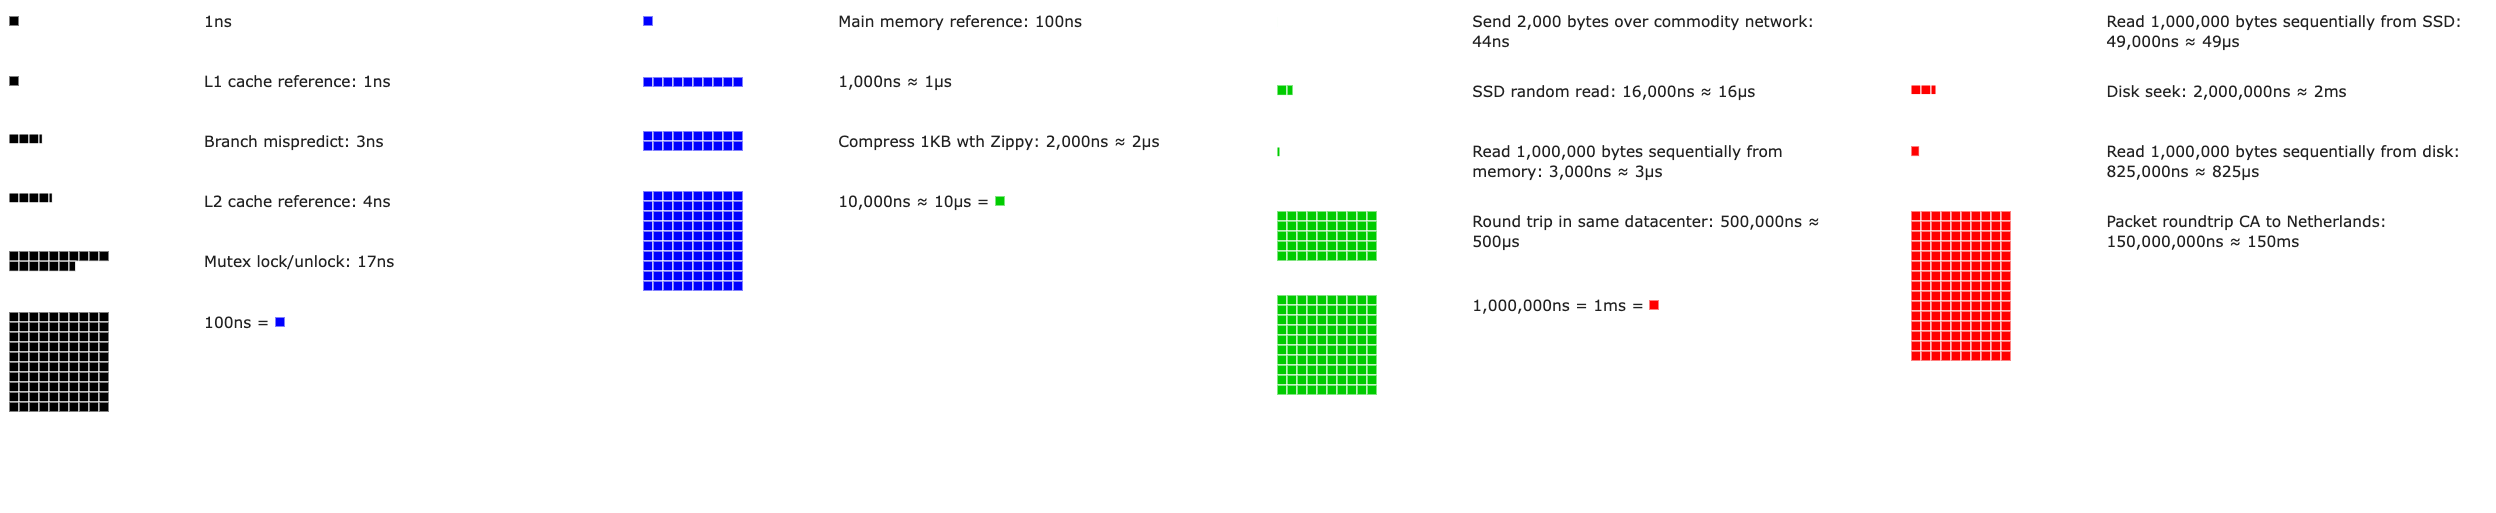
Latency numbers every programmer should know
- Some normal operation cost in 2010. So may be slow now.
| Operation name | Time |
|---|---|
| L1 cache reference | 0.5 ns |
| Branch mispredict | 5 ns |
| L2 cache reference | 7 ns |
| Mutex lock/unlock | 100 ns |
| Main memory reference | 100 ns |
| Compress 1K bytes with Zippy | 10,000 ns = 10 µs |
| Send 2K bytes over 1 Gbps network | 20,000 ns = 20 µs |
| Read 1 MB sequentially from memory | 250,000 ns = 250 µs |
| Round trip within the same datacenter | 500,000 ns = 500 µs |
| Disk seek | 10,000,000 ns = 10 ms |
| Read 1 MB sequentially from the network | 10,000,000 ns = 10 ms |
| Read 1 MB sequentially from disk | 30,000,000 ns = 30 ms |
| Send packet CA (California) ->Netherlands->CA | 150,000,000 ns = 150 ms |
- ns = nanosecond, µs = microsecond, ms = millisecond
1 ns = 10^-9 seconds
1 µs= 10^-6 seconds = 1,000 ns
1 ms = 10^-3 seconds = 1,000 µs = 1,000,000 ns
- Memory is fast but the disk is slow
- Avoid disk seeks
- Compress data before sending them through network
-
It takes time to send data between different data centers.
-
Visualization
https://colin-scott.github.io/personal_website/research/interactive_latency.html
Availability numbers
-
SLA: an agreement between service provider and customers, defines the server uptime you should deliver.
-
The more nines, the better
Availability % Downtime per day Downtime per week Downtime per month Downtime per year 99% 14.40 minutes 1.68 hours 7.31 hours 3.65 days 99.99% 8.64 seconds 1.01 minutes 4.38 minutes 52.60 minutes 99.999% 864.00 6.05 seconds 26.30 seconds 5.26 minutes 99.9999% 86.40 milliseconds 604.80 2.63 seconds 31.56 seconds
Example:Estimate Twitter QPS and storage requirements
- Assumptions:
- 300 million monthly active users.
- 50% of users use Twitter daily.
- Users post 2 tweets per day on average.
- 10% of tweets contain media.
- Data is stored for 5 years.
- Estimations:
- Query per seconds QPS estimate:
- DAU(daily active user): 300 million * 50% = 150 million
- Tweets QPS: 150 million * 2 tweets / 24hours/3600s = \~3500
- PeekQPS = 2 * QPS = \~7000
- Storage estimate:
- Average tweet size:
- Tweet_id 64 bytes
- Text 140 bytes
- Media 1MB
- 150 million * 2 *10% * 1MB = 30TB
- 5-year media storage: 30 TB * 365 *5 = \~55PB
- Average tweet size:
- Query per seconds QPS estimate:
Tips
- Rounding and approximation
- Write down your assumption
- Label your units
- QPS, peak QPS, storage, cache, number of servers, etc. are commonly asked.